What each Claude Code usage pattern costs
48,000 real turns measured across 67 sessions. Where the money goes, why turn 400 costs three times turn 10, and how much compaction gives back.
- claude code
- cost
Contents
- A note on method
- Where the money goes
- Why turn 400 costs three times turn 10
- What compaction does, measured
- Subagents: 3.3 to 5.2 times cheaper per turn
- The distribution is uneven, and that is where you can act
- What the cache avoided
- This post, specifically
- How to measure your own
- What I changed after seeing this
- What I could not measure
- Frequently asked questions
- Sources
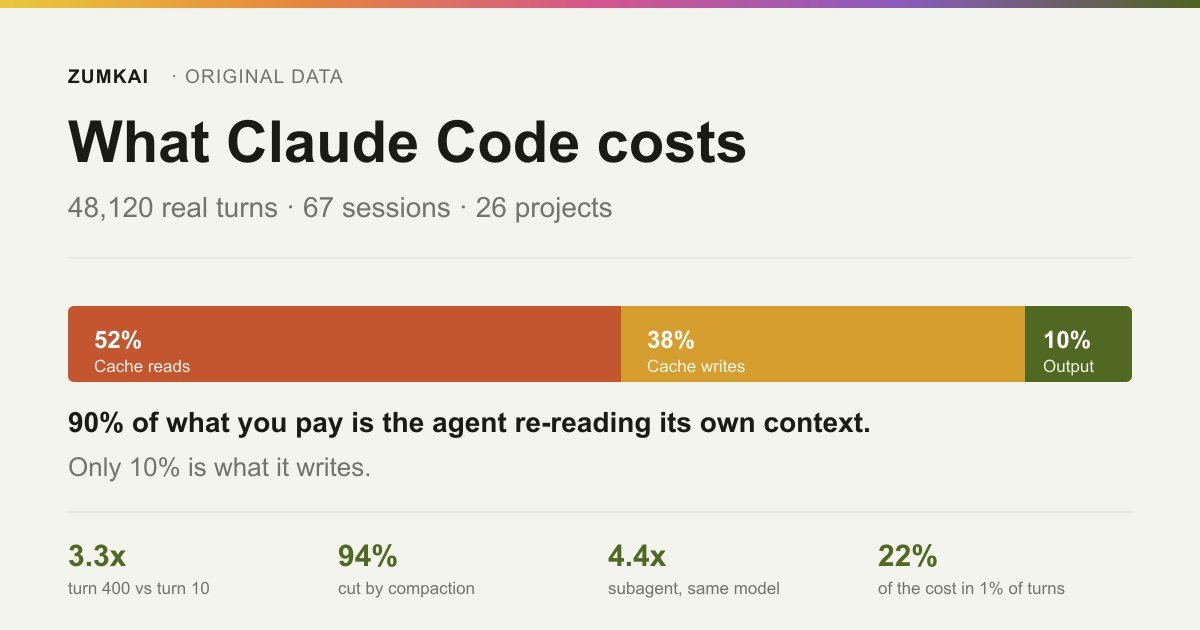
90% of what you pay is the agent rereading its own context. Only 10% is what it writes.
I thought the reverse. The intuition anyone gets from using it is that the cost sits in the answer, because the answer is the part you see. I measured 48,120 turns of real work and the numbers land nowhere near that.
A note on method
Read this before the numbers, because it changes how you read them.
What I measured. Every local Claude Code session on my machine between 29 June and 20 August 2026: 67 sessions, 26 projects, 48,120 priced assistant turns. Another 86 turns fell outside, as synthetic messages from Claude Code itself with no billing attached. Claude Code records each turn as JSONL under ~/.claude/projects/, with input_tokens, cache_creation_input_tokens, cache_read_input_tokens, output_tokens and the reasoning tokens. I extracted the counters and the metadata alone, and none of the message content.
The dollar figures are API list price, and not what I paid. I use a subscription. I converted the tokens at the public Claude API rates to get a unit comparable across usage patterns. Treat the figures as relative weight, and not as an invoice. The proportions transfer to your case; the totals do not.
If your case is the opposite of mine, paying per token, at volume, with no subscription in the middle, the arithmetic that matters is different, and it sits in where the money leaks in production.
Where this is weak. One operator, a seven-week window, a mix of web and content projects. It is no controlled benchmark, and it does not run the same task under different conditions. Five models appear in the sample (Fable 5, Opus 5, Opus 4.8, Sonnet 5 and Haiku 4.5) along with 22 distinct Claude Code versions. The effort level concentrates on xhigh, which pushes the reasoning tokens up relative to anyone running the default.
Compaction detection is heuristic. I counted as an event every drop in cache reads below 55% of the previous value, starting from a peak above 150,000 tokens. That captures compaction and may also capture a /clear or a session restart. I state the criterion so you can judge it.
Where the money goes
The table that rearranged my head:
| Component | Share | What it is |
|---|---|---|
| Cache reads | 52.05% | Rereading history already processed, at 10% of the input rate |
| Cache writes | 37.94% | Recording what changed, at 1.25x or 2x the input rate |
| Output | 9.98% | The text and code the model writes |
| Raw input | 0.03% | What you type |
Add the first two rows: almost 90% of the bill is context moving in and out of cache. What the model produces is a tenth.
That carries a practical consequence which sounds backwards: asking for a longer answer is cheap; having a longer conversation is expensive. Doubling the answer's length touches 10% of the bill. Doubling the history's length touches the other 90%, and it touches every following turn, and not that one alone.
The most expensive turn in the whole sample illustrates it better than any explanation. A single turn on Opus 5, with 989,308 tokens written to a one-hour cache and 1,075 tokens of output:
| Item | Calculation | Cost |
|---|---|---|
| 1h cache write | 989,308 × US$10/M | US$9.893 |
| Output | 1,075 × US$25/M | US$0.027 |
| Turn total | US$9.92 |
Ten dollars in one turn, and 99.7% of it went on storing context. The model's own writing cost under three cents.
Why turn 400 costs three times turn 10
Each request resends the whole conversation. As it grows, so does what has to come out of cache on every turn. The measured curve:
| Turn in the session | Turns in the sample | US$ per turn | Mean cache read |
|---|---|---|---|
| 1 to 10 | 661 | 0.228 | 44,275 |
| 11 to 25 | 944 | 0.176 | 72,619 |
| 26 to 50 | 1,341 | 0.259 | 103,926 |
| 51 to 100 | 2,252 | 0.322 | 160,209 |
| 101 to 200 | 4,026 | 0.351 | 246,015 |
| 201 to 400 | 6,624 | 0.509 | 366,296 |
| 401 to 800 | 8,749 | 0.750 | 569,997 |
| 801 onward | 11,082 | 0.732 | 555,122 |
Three things in that table.
The climb is real and predictable. From block 1-10 to block 401-800, the cost per turn multiplies by 3.3, and the mean cache read by 12.9. The same question, asked early or late in the session, carries different prices.
Band 11-25 is cheaper than 1-10. The first turns load CLAUDE.md, memory, tool definitions and skill descriptions, all written to cache at write price. After that the prefix gets read, which is ten times cheaper. Takeoff costs more than cruising, and it is the economic argument for keeping CLAUDE.md lean: every new session writes it at full price.
The plateau at the end is no economy of scale. From block 401-800 to 801+, the cost per turn drops from US$0.750 to US$0.732. That is automatic compaction holding the context at a ceiling. The session gains no efficiency; it stops growing because something trims it.
The mechanism behind that sits in why your agent forgets.
What compaction does, measured
318 compaction events, across 62 sessions with more than 20 turns.
| Tokens | |
|---|---|
| Peak cache read, before | 490,962 |
| Right after | 30,888 |
| Reduction | 94% |
Converted into money, per following turn:
| Model | Before | After | Gives back |
|---|---|---|---|
| Opus 5 | US$0.245 | US$0.015 | US$0.230 per turn |
| Fable 5 | US$0.491 | US$0.031 | US$0.460 per turn |
The point that matters: the saving belongs to every turn after the one where you compact, and not to that turn. In a session with 200 turns still to run, compacting early gives back somewhere between US$46 and US$92 at list price. Waiting for automatic compaction to fire means paying full price on each turn until then.
It is the measurement that changed my behavior most: I started running /compact in the gap between tasks instead of waiting.
Subagents: 3.3 to 5.2 times cheaper per turn
The raw number is 5.9x, and it misleads. Part of the difference is that I ran subagents on cheaper models: half of them on Opus 5, 13% on Sonnet 5, against a main thread running almost all of its turns on Fable 5 and Opus 5. Comparing without controlling for that mixes model price with context size.
Controlling for model, comparing a subagent turn against a main turn on the same model:
| Model | Main | Subagent | Ratio |
|---|---|---|---|
| Fable 5 | US$0.830 (n=16,996) | US$0.160 (n=3,808) | 5.2x |
| Opus 5 | US$0.361 (n=16,465) | US$0.082 (n=6,191) | 4.4x |
| Opus 4.8 | US$0.365 (n=2,218) | US$0.110 (n=645) | 3.3x |
The advantage holds with the model fixed, and the cause shows up in the context:
| Role | Median cache read |
|---|---|
| Main conversation | 394,322 tokens |
| Subagent | 55,043 tokens |
Seven times less context per turn. The subagent works in its own small window, so each of its turns rereads little. The main conversation rereads all of it.
A projection, declared as a projection: had those 12,441 subagent turns run on the main thread, at its mean cost, they would have cost US$7,268 instead of US$1,240. And that understates the difference, because it ignores the second-order effect: each file read that stayed inside the subagent is a read that did not fatten the main context for every following turn.
In the sample, 15 of the 67 sessions used a subagent, with a median of 6 per session and one session reaching 103. The criterion for when to delegate sits in subagents: when to delegate.
The distribution is uneven, and that is where you can act
Cost per turn, sorted:
| Percentile | US$ |
|---|---|
| Median | 0.279 |
| p90 | 0.785 |
| p99 | 5.656 |
| Maximum | 19.169 |
1% of the turns accounts for 22% of the total cost. At session level the concentration runs higher: the most expensive 10% hold 53% of the spend, with a median of US$87 against a mean of US$311 and a maximum of US$3,034.
That is good news. Optimizing the median turn is not worth the effort, because it costs thirty cents. The payoff lies in finding the handful of turns and sessions that dominate the bill, and they carry a recognizable signature: a file read that was too large, a session past a thousand turns with no /clear, and a broad search that dumped a pile of results into the context at once.
The catalog of those patterns sits in the Claude Code traps.
What the cache avoided
The mechanism deserves sizing before any optimization of your own.
| US$ | |
|---|---|
| Real cost of the sample | 22,084 |
| The same load, with no cache at all | 122,303 |
| Saving | 100,219 (81.9%) |
Without a cache, each turn would reprocess the whole history at full input price. One curious detail from the sample: the writes split almost in half between the two TTLs, 49.0% in the one-hour cache and 51.0% in the five-minute one.
Reasoning tokens made up 18.0% of the output, US$385 in total. It is a real cost, and a small one next to the 90% the context consumes.
This post, specifically
The project that produced this blog appears in the sample and stands as the most honest example I have, because you are reading its output.
One session, 864 turns, all on Opus 5:
| Component | Tokens | US$ | Share |
|---|---|---|---|
| Cache reads | 369,645,581 | 184.82 | 48.6% |
| Cache writes | 20,527,744 | 160.20 | 42.1% |
| Output | 1,405,432 | 35.14 | 9.2% |
| Raw input | 1,728 | 0.01 | 0.0% |
| Total | 380.16 |
Eighteen posts published, with research, source verification, schema generation and a cluster audit. That works out to US$21.12 per post at list price.
The detail that closes the argument: the entire output, 1.4 million tokens of text, code and tables, cost US$35.14. The other US$345 went on the agent rebuilding, turn after turn, what it had already seen. The project's proportions (48.6 / 42.1 / 9.2) come within a hair of the full sample's (52.0 / 37.9 / 10.0), which is a good sign that the pattern is no accident of one project.
How to measure your own
None of this depends on believing me. The data sits on your machine.
# -*- coding: utf-8 -*-
import json, os, glob, collections

BASE = os.path.expanduser("~/.claude/projects")
PRICE = {  # USD per million tokens, Claude API list price
  "claude-opus-5":  dict(inp=5.0,  w5m=6.25,  w1h=10.0, r=0.50, out=25.0),
  "claude-fable-5": dict(inp=10.0, w5m=12.50, w1h=20.0, r=1.00, out=50.0),
}
total = collections.Counter()

for path in glob.glob(os.path.join(BASE, "*", "*.jsonl")):
    with open(path, encoding="utf-8", errors="replace") as fh:
        for line in fh:
            if '"usage"' not in line: continue
            try: d = json.loads(line)
            except Exception: continue
            if d.get("type") != "assistant": continue
            m = d.get("message") or {}
            u = m.get("usage") or {}
            p = PRICE.get(m.get("model"))
            if not u or not p: continue
            cc = u.get("cache_creation") or {}
            total["reads"]  += u.get("cache_read_input_tokens", 0) * p["r"] / 1e6
            total["writes"] += (cc.get("ephemeral_5m_input_tokens", 0) * p["w5m"]
                              + cc.get("ephemeral_1h_input_tokens", 0) * p["w1h"]) / 1e6
            total["output"] += u.get("output_tokens", 0) * p["out"] / 1e6

s = sum(total.values())
for k, v in total.most_common():
    print(f"{k:<10} US$ {v:8.2f}   {100*v/s:5.1f}%")
Run it and compare your proportions with mine. If your output runs well past 10%, your Claude Code habits diverge from mine, and the thing worth optimizing in your case is something else.
What I changed after seeing this
Four changes, all derived straight from the numbers above.
I compact in the gap, and not when the system says so. Each deferred compaction costs between US$0.23 and US$0.46 per turn until it happens.
I delegate large reads. A subagent turn costs a fifth of a main turn, and the file it read stops weighing on the context forever.
I use /clear when I switch subjects. An old conversation stays active. Claude Code resends it and charges for it in every following message.
I choose the model at the start of the session. Switching models midway invalidates the whole cache, and the cache is 90% of the bill. That action and the other seven that break the cache sit in Claude Code in production.
What I could not measure
Three gaps I would rather have closed, declared instead of filled with an estimate.
Agent teams do not appear in the sample. I wanted to compare the cost of an agent team against an ordinary session, because that is the configuration with a reputation for being expensive. None of the 67 sessions used the feature, so I have no measurement of my own and I will not convert documentation into a number that sounds measured.
No controlled comparison between models exists here. To say which model delivers more per dollar, you would have to run the same task on each and grade the result. I ran different work on different models, as the task demanded, and that confounds price with load.
Cost per completed task remains open. Everything here is cost per turn and per session, which is what the log allows counting. A session can hold five tasks or half of one, and the log does not mark where one ends and the next begins. It is the metric that matters most to whoever sets a budget, and the one the raw data cannot deliver on its own.
The first gap closes with use. The other two need experimental design, and not more collection.
Frequently asked questions
Are these figures what you paid?
No. I use a subscription, and I converted the measured tokens at Claude API list price to get a unit comparable across usage patterns. The proportions and the ratios between patterns transfer to your case; the dollar totals do not.
Why is output only 10% of the cost?
Because the model keeps nothing between requests. On each turn the whole conversation gets resent and reprocessed, while the new answer is the piece at the end. In a 400-turn session, the history already runs orders of magnitude larger than any individual answer.
Is switching to a cheaper model worth it?
In my sample, Fable 5 turns cost a mean of US$0.707 against US$0.284 on Opus 5, which reflects both the list price, twice as high, and the kind of work I ran on each. Since I did not run the same task on both, that number cannot tell you which delivers more per dollar. It can tell you that the model choice moves the bill more than the list-price difference suggests.
How do I know whether my session is expensive right now?
/context shows the current distribution by category and /cost shows the session's spend. If the cache read per turn passes a few hundred thousand tokens, you are on the expensive part of the curve and one compaction pays for itself in a handful of turns.
Sources
- Anthropic — Claude API: Pricing. Accessed 20 August 2026.
- Anthropic — Claude Code Docs: How Claude Code uses prompt caching. Accessed 20 August 2026.
- Anthropic — Claude Code Docs: Explore the context window. Accessed 20 August 2026.
- Anthropic — Claude Code Docs: Create custom subagents. Accessed 20 August 2026.
- Anthropic — Claude Code Docs: How Claude Code works. Accessed 20 August 2026.
Primary data: 48,120 priced assistant turns, extracted from ~/.claude/projects/, 67 sessions across 26 projects, between 29 June 2026 and 20 August 2026. Extraction script above, reproducible on your own machine.
Verified on 20 August 2026.
Review trigger: rerun the measurement when (a) Claude API list prices change, (b) automatic compaction changes its threshold, or (c) the sample doubles in size, which would allow separating usage patterns by task type.
Read next

Motion •
Motion Design for the Web: The Complete Guide
Scroll, text, images and video: the complete catalog of motion techniques for the web, with implementation in Next.js and the cases where each one pays off.
- motion
- scroll

The definitive guide — a Next.js site built around motion and scroll
The scroll foundation that, when missing, keeps the animations from working at all: Lenis, GSAP and Next.js wired in the right order and the mistakes to avoid.
- next.js
- lenis
Infra •
Documentation: deploying a Next.js application with GitHub + Hostinger
Every push becomes a live site with no hosting panel involved: connecting GitHub to Hostinger, the build settings that break and the checks after each deploy.
- deploy
- github